How to draw Bending Moment diagrams?
In drawing of bending moment diagrams, we have to follow certain guidelines in strict manner as explained in earlier article guide lines of beam diagram. For illustration and clear understanding of the process of drawing of beam diagrams, we have drawn following typical beam diagrams with very common beams and their loading patterns. These are –
- Drawing of beam diagrams for a cantilever beam with point load.
- Drawing of beam diagrams for a cantilever beam with uniformly distributed load.
- Drawing of beam diagrams for a cantilever beam with uniformly varying load.
- Drawing of beam diagrams for a simply supported beam loaded with a couple.
Beam diagram for a Cantilever with Point load
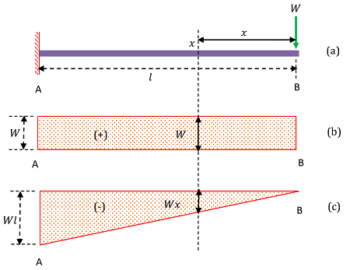
Consider about a cantilever beam of length ( l ) loaded with a point load ( W ) at its free end as shown in figure.
Space diagram –
Space diagram for the beam is drawn in figure ( a ).
Shear Force diagram –
If there is no other load between two points of a beam, then shear force between these two points will remain constant. Therefore, ( SF ) diagram will be parallel to the base line between these two points.
- Point load ( W ) is loaded at free end point B .
- There is no other load between the points A and B .
- Hence, shear force diagram is a rectangle of width ( W ) between these two points.
- Effect of load has a tendency to rotate the beam in clockwise direction.
- So, shear force is positive. Hence, ( SF ) diagram is drawn in positive side.
Shear Force diagram for the beam is drawn in figure ( b ).
Bending Moment diagram –
If there is no other load between two points of a beam, then bending moment between these two points will change linearly. Therefore, BM diagram will be an inclined straight line between these two points.
Because, Bending Moment = Load × Distance. ( As the distance of the beam section from load increases, bending moment also increases linearly. )
- Bending moment of load ( W ) at point B is zero.
- Bending moment of load ( W ) at point A is ( W \times l = W l ) .
- No other load is present in between A and B .
- Therefore ( BM ) diagram is a straight line inclined to base line forming a triangle.
- Bending moment has a tendency to bend the beam in ∩ shape. Hence it is hogging moment or negative moment.
Bending moment diagram for the beam is drawn in figure ( c ).
Beam diagram for a Cantilever with Uniformly Distributed Load
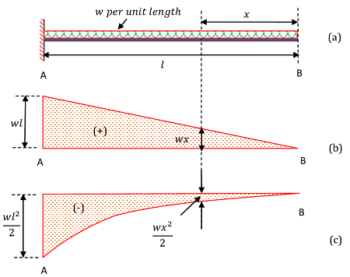
Consider about a cantilever beam of length ( l ) loaded with a uniformly distributed load ( UDL ) of magnitude, ( w ) unit per unit length of beam as shown in figure.
Space diagram –
Space diagram for the beam is drawn in figure ( a ).
Shear Force diagram –
If there is an ( UDL ) between two points of a beam, then shear force between these two points will change linearly between these points.
Rate of loading of UDL = w units per unit length of beam. Thus –
- Total load at free end will be [ W = ( w \times 0 ) = 0 ]
- Total load at a distance of ( x ) unit from free end will be [ W = ( w \times x ) = w x ]
Therefore, ( SF ) diagram between these two points will be a straight line inclined to the base line.
- There is no other load between the points A and B .
- Total load at point B is ( 0 ) and at point A is ( w l )
- Hence, shear force diagram is a triangle of width ( w l ) .
- Effect of load ( wx ) has a tendency to rotate the beam in clockwise direction.
- So, positive shear force has developed in beam. Therefore, ( SF ) diagram is drawn in positive side.
Shear Force diagram for the beam is drawn in figure ( b ).
Bending Moment diagram –
Rate of loading of UDL = w units per unit length of beam.
We know that, Bending Moment ( M ) = Load × Distance of centre of gravity of load.
Therefore, magnitude of bending moment at a distance ( x ) from free end of beam will be –
M = \left ( w \ x \right ) \times \left ( \frac {x}{2} \right )
= \left ( \frac { w x^2}{2} \right )
Thus, change in bending moment is proportional to ( x^2 ) . This is a required condition of a parabola curve.
Therefore, bending moment diagram of a beam carrying an ( UDL ) between two points will be a parabolic curve between that points.
- Bending moment at point B is zero.
- Total load acting at point A is katex] ( W = w \times l = w l ) [/katex]. Therefore, magnitude of bending moment will be \left ( wl \times \frac {l}{2} = \frac {wl^2}{2} \right )
- No other load is present in between A and B .
- Therefore, ( BM ) diagram is a parabola curve.
- Bending moment has a tendency to bend the beam in ∩ shape. Hence it is hogging moment or negative moment.
Bending moment diagram for the beam is drawn in figure ( c ).
Beam diagram for Cantilever with Varying Load
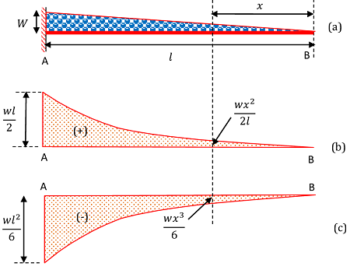
Consider about a cantilever beam of length ( l ) loaded with a gradually varying load from zero at free end B to ( w ) per unit length at the fixed end A as shown in figure.
Space diagram –
Space diagram for the beam is drawn in figure ( a ).
Shear Force diagram –
We know that, Magnitude of load on beam ( W ) = Total area of the triangular load diagram.
Therefore, \quad W = \left ( \frac {1}{2} \right ) \times \text {base} \times {\text {height}}
Also, height of load triangle at a distance ( x ) from free end of beam will be \left ( \frac {wx}{l} \right )
Therefore, load \quad W = \left ( \frac{1}{2} \right ) \times x \times \left ( \frac {w x}{l} \right )
= \left ( \frac {w x^2}{2l} \right )
Thus, change in load i.e. shear force is proportional to ( x^2 ) . This is a required condition of a parabola curve.
Hence, shear force diagram between two points of a beam carrying an uniformly varying load will be a parabola curve.
Effect of load \left ( \frac {w x^2}{2l} \right ) has a tendency to rotate the beam in clockwise direction. Hence ( SF ) diagram is positive.
Shear force diagram for the beam is drawn in figure ( b ).
Bending Moment diagram –
We know that, Bending Moment ( M ) = Load × Distance of centre of gravity of load.
And, centre of gravity of a triangle is \left ( \frac {\text {height}}{3} \right ) from base.
Therefore, magnitude of bending moment at a distance ( x ) from free end of beam will be –
M = \left ( \frac {w x^2}{2l} \right ) \left ( \frac {x}{3} \right )
= \left ( \frac {wx^3}{6l} \right )
Thus, change in bending moment is proportional to ( x^3 ) . This is a required condition of a cubic curve.
Hence, bending moment between the two points of a beam carrying an uniformly varying load will be a cubic curve between these points.
Bending moment diagram for the beam is drawn in figure ( c ).
Loading of a Couple
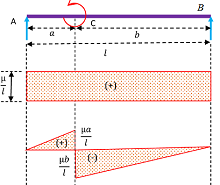
Consider about a simply supported beam AB of length ( l ) which is loaded with an anti-clockwise couple ( \mu ) at point C
Tendency of the couple ( \mu ) is to lift the beam at support B and press the beam at support A . Therefore, reaction ( R_A ) will be upward and ( R_B ) will be downward.
STEP – 1 ( Find end reactions )
Taking the moments of reactions ( R_A ) and ( R_B ) at point A we get –
R_B \times l = \mu ( Reaction R_B is downward. )
So, \quad R_B = \left ( \frac {\mu}{l} \right ) ( Downward direction ↓ )
Also, ( R_A + R_B ) = \mu
So, \quad R_A = \left ( \frac {\mu}{l} \right ) ( Upward direction ↑ )
STEP – 2 ( Draw SF diagram )
- Reaction ( R_A ) is upward and at ( R_B ) is downward.
- There is no other force between points A and B
- The effect of reactions has a tendency to rotate the beam in clockwise direction.
- Therefore, shear force is positive. SF diagram is a rectangle in positive direction and its side is \left ( + \frac {\mu}{l} \right )
STEP – 3 ( Draw BM diagram )
Taking the moments about point A we have –
- Bending moment at point A will be –
M_A = R_A \times 0 = 0 ( Because distance is zero )
- Bending moment at just left of point C will be –
M_{C ( left )} = R_A \times a
= \left ( \frac {\mu}{l} \right ) \times a
= \left ( \frac {\mu a}{l} \right )
- Bending moment at just right of point C will be –
M_{C ( right )} = R_A \times a - \mu
= \left ( \frac {\mu}{l} \right ) \times a - \mu
= \mu \frac {\left ( a - l \right )}{l}
Because, \quad \left ( l = a + b \right )
Therefore, M_{C ( right )} = - \frac {\mu b}{l}
- Bending moment at point B will be –
M_B = \left ( R_A \times l \right ) - \mu
= \left ( \frac {\mu}{l} \times l \right ) - \mu = 0
( SF ) and ( BM ) diagrams are shown in figure.
Loading on a Bracket
Sometimes a load is applied on a ( L ) shaped bracket which is mounted on a beam.
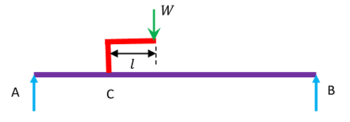
Consider about a beam which has a point load ( W ) loaded on a bracket of length ( l ) . In this type of loading the load has twin effects –
- It provides an effect of point load of magnitude ( W ) at the point of attachment of bracket with beam.
- It produces a clockwise couple ( positive moment ) of magnitude ( W \times l ) .
These two effects of point load and couple are then treated separately in addition to other similar loads on beam.
See numerical problems based on this article.