What is called Displacement Time Graph?
Characteristics of motion of a moving body can be quickly understood with the aid of graphs. For this purpose, the position, velocity and acceleration of a moving body are represented in vertical axis and time is represented on horizontal axis. These are called displacement time graph, velocity time graph and acceleration time graph etc.
Therefore, displacement time graph is a graphical representation of motion of a moving body in which time is plotted in x-axis and displacement is plotted in y-axis.
- In displacement time graph, displacement is plotted along Y axis and time is plotted along X axis.
- In velocity time graph, velocity is plotted along Y axis and time is plotted along X axis.
- In acceleration time graph, acceleration is plotted along Y axis and time is plotted along X axis.
Displacement time graphs are important tool to understand the characteristics of motion. These are of following types –
- Displacement time graph of body at rest.
- Displacement time graph of body moving with uniform motion.
- Displacement time graph of body moving with uniform acceleration.
- Displacement time graph of body moving with retardation.
1. Displacement time graph for a body at Rest
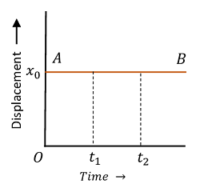
Consider about the figure showing graph of a body at rest –
- At time ( t_0 ) , the initial position of body is at point ( x_0 ) . Also at times ( t_1 ) and ( t_2 ) , the position of body is still at ( x_0 ) . This shows that, position of body is not changing with time.
- Hence, displacement – time graph AB is a straight line parallel to time axis.
- The slope of the displacement – time is zero. This represents zero velocity of body.
- The displacement of body is not changing with time. Hence, the graph represents a body which is in rest.
2. Displacement time graph for Uniform Speed
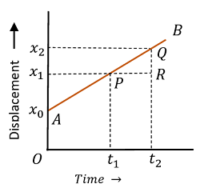
Consider about the figure showing graph of a body moving with uniform speed –
- Displacement – time graph AB is a straight line with constant slope.
- At time ( t_0 ) , the initial position of body is at point ( x_0 ) . Also at times ( t_1 ) and ( t_2 ) , the positions of body are at ( x_1 ) and ( x_2 ) . This shows that, position of body is changing with time.
- Hence, the body is in motion.
- Displacement – time line ( AB ) is inclined to time axis. It has a constant slope.
Slope of the graph is –
\tan \theta = \left ( \frac {QR}{PR} \right ) = \left ( \frac {x_2 - x_1}{t_2 - t_1} \right )
Or, \quad \tan \theta = \left ( \frac {\text {Displacement}}{\text {Time}} \right ) = \text {Velocity}
- Therefore, slope of the graph represents the velocity of body.
- Constant slope indicates that the body is moving with uniform speed or velocity. Hence, acceleration acting on the body is zero.
3. Displacement time graph for Uniform Acceleration
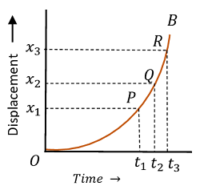
Consider about the figure showing of a body moving with uniform acceleration –
- Displacement – time graph OB is a curve with increasing slope.
- In equal time intervals, displacements are increasing. Because, time intervals ( t_3 - t_2 ) and ( t_2 - t_1 ) are equal, but displacement ( x_3 - x_2 ) > ( x_2 - x_1 ) .
- Slope of the graph at point ( P ) is \quad \tan \theta_{1} = \left ( \frac {x_2 - x_1}{t_2 - t_1} \right ) .
- Slope of the graph at point ( Q ) is \quad \tan \theta_{2} = \left ( \frac {x_3 - x_2}{t_3 - t_2} \right ) .
But, \quad ( t_2 - t_1 ) = ( t_3 - t_2 ) \quad and \quad ( x_3 - x_2 ) > ( x_2 - x_1 )
Therefore, \quad ( \tan \theta_{2} > \tan \theta_{1} ) .
- Thus, slope of the graph is increasing. Therefore, it is representing an accelerated motion of a body.
- Curve ( OB ) is a parabola which bends upwards.
4. Displacement time graph of Retardation
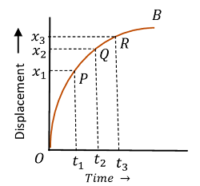
Consider about the figure showing graph of a body moving with uniform retardation –
- Displacement – time graph OB is a curve with decreasing slope.
- In equal time intervals, displacements are decreasing. Because, time intervals ( t_3 - t_2 ) and ( t_2 - t_1 ) are equal, but displacement ( x_3 - x_2 ) < ( x_2 - x_1 ) .
- Slope of the graph at point ( P ) is \quad \tan \theta_{1} = \left ( \frac {x_2 - x_1}{t_2 - t_1} \right ) .
- Slope of the graph at point ( Q ) is \quad \tan \theta_{2} = \left ( \frac {x_3 - x_2}{t_3 - t_2} \right ) .
But, \quad ( t_2 - t_1 ) = ( t_3 - t_2 ) \quad and \quad ( x_3 - x_2 ) < ( x_2 - x_1 )
Therefore, \quad ( \tan \theta_{2} < \tan \theta_{1} ) .
- Thus slope of the graph is decreasing. Therefore, it is representing a retarded motion of a body.
- Curve ( OB ) is a parabola which bends downwards.
Velocity Time Graph
In velocity – time graph, velocity is plotted along Y axis and time is plotted along X axis.
These are of following types –
- Velocity time graph of body moving with uniform velocity.
- Velocity time graph of body moving with uniform acceleration.
- Velocity time graph of body moving with accelerated motion.
- Velocity time graph of body moving with retardation motion.
1. Velocity time graph of Uniform Velocity
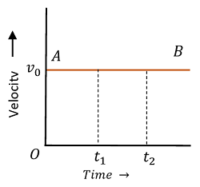
Consider about the figure showing graph of a body moving with uniform velocity –
- At time ( t_0 ) , the initial velocity of body is ( v_0 ) . Also at times ( t_1 ) and ( t_2 ) , the velocities of body are ( v_0 ) . This shows that, velocity of body is not changing with time.
- Therefore, velocity time graph AB is a straight line parallel to time axis.
- The slope of the velocity time line ( AB ) is zero. This represents zero acceleration of body.
- The velocity of body is not changing with time.
- Hence, this graph represents a body moving with uniform velocity.
2. Velocity time graph of Uniform Acceleration
Consider about the figure showing graph of a body moving with uniform acceleration –
- Velocity time graph AB is a straight line with constant slope.

030406 VELOCITY-TIME GRAPH OF BODY WITH UNIFORM ACCELERATION - At time ( t_0 ) , the initial velocity of body is ( v_0 ) . Also at times ( t_1 ) and ( t_2 ) , the velocities of body are ( v_1 ) and ( v_2 ) . This shows that, velocity of body is changing with time.
- Hence, the body is in acceleration.
- Velocity – time line ( AB ) is inclined to time axis. It has a constant slope.
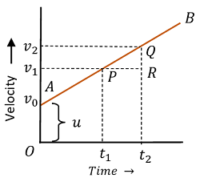
Slope of graph is –
\tan \theta = \left ( \frac {QR}{PR} \right ) = \left ( \frac {v_2 - v_1}{t_2 - t_1} \right )
Or, \quad \tan \theta = \left ( \frac {\text {Change in velocity}}{\text {Time}} \right ) = \text {Acceleration}
- Therefore, slope of the graph represents the acceleration of body.
- Constant slope indicates that, velocity of body is increasing with uniform rate.
- Hence, body is moving with uniform acceleration.
3. Velocity time graph of Accelerated motion
Consider about the figure showing graph of a body moving with accelerated velocity –
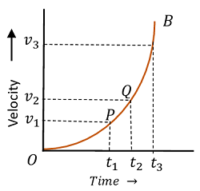
- Velocity time graph AB is a curve with increasing slope.
- In equal time intervals, change in velocity is increasing. Because, time intervals ( t_3 - t_2 ) and ( t_2 - t_1 ) are equal, but change in velocity ( v_3 - v_2 ) > ( v_2 - v_1 ) .
- Slope of the graph at point ( P ) is \quad \tan \theta_{1} = \left ( \frac {v_2 - v_1}{t_2 - t_1} \right ) .
- Slope of the graph at point ( Q ) is \quad \tan \theta_{2} = \left ( \frac {v_3 - v_2}{t_3 - t_2} \right ) .
But, \quad ( t_2 - t_1 ) = ( t_3 - t_2 ) \quad and \quad ( v_3 - v_2 ) > ( v_2 - v_1 )
Therefore, \quad ( \tan \theta_{2} > \tan \theta_{1} ) .
- Slope of the graph is increasing. Therefore, it is representing an accelerated velocity of a body.
- Curve ( OB ) is a parabola which bends upwards.
4. Velocity time graph of Retarded motion
Consider about the figure showing graph of a body moving with retarded velocity –
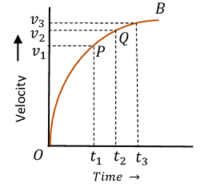
- Velocity time graph OB is a curve with decreasing slope.
- In equal time intervals, velocity is decreasing. Because, time intervals ( t_3 - t_2 ) and ( t_2 - t_1 ) are equal, but change in velocity ( v_3 - v_2 ) < ( v_2 - v_1 ) .
- Slope of the graph at point ( P ) is \quad \tan \theta_{1} = \left ( \frac {v_2 - v_1}{t_2 - t_1} \right ) .
- Slope of the graph at point ( Q ) is \quad \tan \theta_{2} = \left ( \frac {v_3 - v_2}{t_3 - t_2} \right ) .
But, \quad ( t_2 - t_1 ) = ( t_3 - t_2 ) \quad and \quad ( v_3 - v_2 ) < ( v_2 - v_1 )
Therefore, \quad ( \tan \theta_{2} < \tan \theta_{1} ) .
- Slope of the graph is decreasing. Therefore, it is representing a retarded velocity motion of a body.
- Curve ( OB ) is a parabola which bends downwards.
See numerical problems based on this article.