What are Shear Force & Bending Moment Diagrams?
Shear force and Bending moment diagrams are graphical tools used by all engineers and structural designers to analyze the cause of failure of any structural member. These are the graphical representation of shear forces and bending moments developed in every section of a loaded beam.
In shear force and bending moment diagrams, the positions of important sections at a point of a beam are plotted along X axis and respective values of shear forces and bending moments at that section are plotted along Y axis.
A line or curve is then drawn joining these co-ordinate points to get the diagram. A rough sketch without any scale is sufficient for illustration of ( SF ) \text {and} ( BM ) diagram.
In next article for “Drawing of beam diagrams“, we have discussed about the detail procedure and steps to draw shear force and bending moment diagrams for some common type of beams and their loading pattern.
Use of Shear Force and Bending Moment diagrams
Different uses of ( SF ) \text {and} ( BM ) diagrams are as follows –
- Shear force and bending moment diagrams are analytical tools. These diagrams are used in designing of structural members along with use of structural analysis to find out the critical sections under severe stress conditions.
- These diagrams are important tools for designers during designing of a structural member. These tools are very useful in taking decisions about geometrical shapes and cross section ( i.e. circular, rectangular, triangular, hollow etc.) of beams, size of section and type of material to be used for a member so that, it can withstand at loads and forces under safe conditions.
- ( SF ) \text {and} ( BM ) diagrams are also used to determine the deflection ( i.e. deformation ) and slope of a beam in a easy method by applying moment area method or conjugate beam method.
How to draw Shear Force and Bending Moment Diagrams?
During drawing of ( SF ) \text {and} ( BM ) diagrams certain specific rules and steps are require to be followed. These are summarized as below –
- First step – At first a space diagram is drawn showing full length of loaded beam, loading pattern, support points of beam, hinges or fixtures and their distances etc.
- Second step – A base line is drawn along X axis. On this line, positions of important points of the beam are shown. Total length of base line represents the total length of the beam.
- Third step – Two more base lines are drawn below the space diagram drawn in First and Second steps. (1) one line for shear force diagram and (2) other for bending moment diagram.
- Fourth step – It is customary to plot positive values of ( SF ) and ( BM ) above base line and negative values below base line. Following this rule, respective co-ordinate points are plotted for ( SF ) and ( BM ) on their base lines.
- Fifth step – Starting from one end of the beam, all the points above and below base line plotted on Y axis are now joined sequentially to get a smooth curve.
- For a cantilever, due to a point load at the free end, bending moment at this point is zero. \left ( \because \text {distance} = 0 \right )
- For a Simply supported beam, bending moments at both end supports are also zero. \left ( \because \text {distance} = 0 \right )
- If there is a vertical point load at a support, then ( SF ) diagram will increase or decrease suddenly at this point. This depends on the net resultant force due to point load and reaction of support.
Summary of guidelines
| Type of loading. | Shear force diagram. | Bending moment diagram. |
| Cantilever with point load at free end | It is a rectangle. | It is a triangle. |
| Cantilever with uniformly distributed load. | It is a triangle. | It is a parabolic curve. |
| Cantilever with uniformly varying load. | It is a parabolic curve. | It is a cubic curve. |
| Simply supported beam with point load. | It is a rectangle. | It is a triangle. |
| Simply supported beam with uniformly distributed load. | It is a triangle. | It is a parabolic curve. |
| Simply supported beam with uniformly varying load. | It is a parabolic curve. | It is a cubic curve. |
Point of Contraflexure
An overhang cantilever beam is analyzed as a combination of two type of beams – (1) Part beyond the support is a simply supported beam and (2) Part before support is a cantilever.
Hence, in the simply supported part of an overhang beam, bending moment is positive, whereas in the cantilever part it is negative. It is thus obvious that, a point on the beam will exist where ( BM ) will change its sign from positive to negative or vice versa.
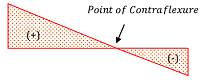
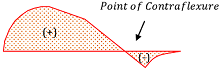
Therefore, in ( BM ) diagram of an overhang beam, a point exist where bending moment becomes zero because it changes its sign from positive to negative or vice versa. At this point, bending moment curve intersects with the base line. This point is called as point of contraflexure.
Importance of Point of Contraflexure
At the point of contraflexure, bending moment changes its sign from positive to negative or vice verse. Therefore, at point of contraflexure, bending moment once become zero.
Therefore, locating the position of point of contraflexure is very useful for designing of roofs, bridges, reinforced concrete and steel structures etc. to save the use of reinforced material at the point of contraflexure.
Above figures show the point of contraflexure in ( BM ) diagram of a beam for (1) A beam with vertical point load and (2) A beam with uniformly distributed load.
See numerical problems based on this article.