How a liquid expands upon heating?
When a liquid mass is heated, its volume get increased with the raise in temperature. This is called thermal expansion in liquids. It is volumetric thermal expansion of liquids.
- When a liquid kept in a container is heated, its container first gets heated and expands.
- As such, first the liquid level in the container drops.
- On further heating, the liquid now gets heated and expands in the container.
- Therefore, the observed expansion of a liquid in a container is less than the actual expansion.
The observed expansion in the liquid is called apparent expansion in liquid which is less than the real expansion of the liquid.
Therefore, \quad \text {Real expansion of liquid} = \text {Apparent expansion in liquid} + \text {Volumetric expansion of container}
Coefficient of Apparent Expansion in Liquids
It is defined as the apparent increase in volume of liquid per unit original volume for ( 1 \degree C ) rise in temperature.
The coefficient of apparent expansion in liquids is given by –
\gamma_{a} = \left ( \frac {\text {Apparent increase in volume}}{\text {Original volume} \ \times \ \text {Rise in temperature}} \right )
Coefficient of Real Expansion in Liquids
It is defined as the real increase in volume of liquid per unit original volume for ( 1 \degree C ) rise in temperature.
The coefficient of real expansion of a liquids is given by –
\gamma_{r} = \left ( \frac {\text {Real increase in volume}}{\text {Original volume} \ \times \ \text {Rise in temperature}} \right )
It should be noted that –
\gamma_{r} = ( \gamma_{a} + \gamma_{g} )
Here ( \gamma_{g} ) is the coefficient of volumetric expansion of glass or other material of the container.
Anomalous Expansion of Water

Behavior of water on heating is peculiar and it is different from other type of liquids. Hence, the term anomalous expansion of water is used.
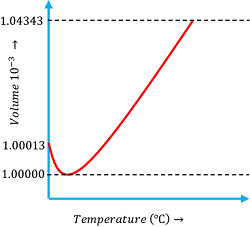
Consider about the expansion behavior of water as shown in figure.
- When water at ( 0 \degree C ) is heated its volume first decreases until its temperature rises up to ( 4 \degree C ) .
- At ( 4 \degree C ) temperature the volume is minimum and thus density is maximum.
- Upon further heating above ( 4 \degree C ) , the volume starts increasing and therefore the density decreases.
- Thus, water at ( 4 \degree C ) has its maximum density.
This behavior of water is called anomalous expansion of water.
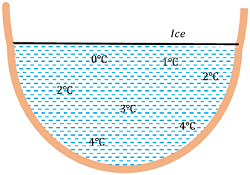
The anomalous expansion of water has a favorable effect on aquatic life as shown in figure.
- Since density of water is maximum at ( 4 \degree C ) , so water at the bottom of the lakes remains at ( 4 \degree C ) whereas at the surface, it freezes to ice.
- The frozen ice on the surface acts as shield of heat loss and prevent further heat loss from the water under it.
- This allows the aquatic life in colder regions to survive in depth of lakes and sea which still remain in liquid state.

Phase diagram of Water
Isotherms of Water
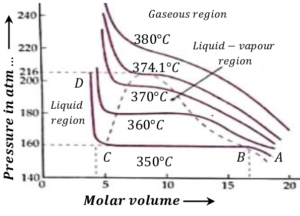
A graph drawn between the pressure ( in atmospheric pressure ) and molar volume of a water-vapor system at constant temperature is called an isotherm.
Following figures shows isotherms for water-vapor system in the temperature range of ( 350 \degree ) to ( 390 \degree ) .
Isotherm at 350º C
Consider the isotherm ABCD at ( 350 \degree C ) . It has following characteristics –
- AB represents compressible vapor phase of water.
- When pressure is increased from A to B the volume decreases. From B to C volume decreases but the pressure remains constant.
- Here, steam is at ( 350 \degree C ) and at pressure ( 160 ) atmosphere.
- At B the substance is in vapor state and at C it is in liquid state.
- Thus, along BC liquid and vapor coexist in equilibrium. Volume at B is gaseous volume ( V_g ) and at C it is liquid volume ( V_l ) .
- When pressure is more than ( 163 ) atmosphere, the substance is in the liquid state.
- Along CD the pressure is increased. There is almost no change in volume. This shows that liquids are non compressible.

Isotherm 360º C to 374º C
Consider about the isotherm at ( 360 \degree C ) . It has following characteristics –
- Here, constant pressure line portion of the diagram i.e. portion B to C has decreased.
- As the temperature increases, the volume difference \left ( V_l - V_g \right ) decreases.
- At ( 374.1 \degree C ) and pressure ( 216 ) atmosphere \left [ ( V_l - V_g ) = 0 \right ] . For this isotherm there is no horizontal portion BC . This temperature is called the critical temperature ( T_c ) of water.
- This means that water can exist as liquid only up to ( 374.1 \degree C ) . Beyond this temperature liquid phase is not possible to get.
Critical temperature
Critical temperature ( T_c ) is the temperature below which a gaseous substance can be liquefied.
For water, critical temperature is ( 374.1 \degree C )
Critical pressure
At critical temperature, the pressure required to liquefy a gas is called its critical pressure ( P_c ) .
For water it is ( 216 ) atmosphere.
Critical volume
At critical temperature and critical pressure, the volume occupied by unit mass of the gas is called critical volume ( V_c ) .
Pressure Temperature Diagram
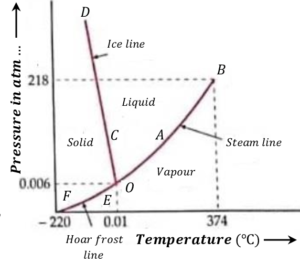
Pressure-temperature diagram for water is shown in figure.

Phase-temperature diagram consists of following three curves –
(1) Vaporization curve AB
It is also called steam line. It is a graph between the pressure and the boiling point of water. Each point on this curve fixes a set of pressure and temperature at which the liquid and the gaseous phases can co-exist.
If pressure is increases above this line, at a fix temperature the vapor will condense into liquid but if the pressure is decreases the liquid will evaporate.
So, all the points above the vaporization curve AB correspond to liquid phase and below it to vapor phase.
(2) Fusion curve CD
Fusion curve is also called ice line. It is a graph between the pressure and the melting point of ice. Each point on this curve fixes a set of pressure and temperature at which the solid and the liquid phases can co-exist.
If pressure is increased above this line, at a fix temperature the solid will melt into liquid but if the pressure is decreased, the liquid will turn into solid.
So, all points above the fusion curve CD correspond to liquid phase and those below it to solid phase.
(3) Sublimation curve EF
Sublimation curve is also called Hoar frost line. It is a graph between pressure and the temperature at which a solid directly changes to vapor state. Each point on this curve fixes a set of pressure and temperature at which the solid and the gaseous phases can co-exist.
If pressure is increases above this line, at a fix temperature the vapor will condense into solid phase but if the pressure is decreases, the solid will change to vapor state.
So, all points above the this curve correspond to solid phase and below it to vapor phase.
Triple Point of Water
It is a unique point on P-T diagram of liquids at which all the three phases of a substance can co exist.
Consider about the pressure-temperature diagram of water as shown in figure. The three curves AB, \ CD and EC on being extended meet at point O which represents triple point.
The values of pressure and temperature corresponding to this point are ( 0.46 ) cm of Hg and ( 273.16 \degree K ) .
Importance of Triple Point –
In modern thermometry, the triple point of water is taken as one of the fixed points because it is independent of external factors such as impurities present in water etc.
See numerical problems based on this article.
