What is Machine Efficiency?
We always worried about the performance of any machine or device that we use for doing some work. Machine Efficiency is one of such character which reflects about the optimum performance of a machine or device. It depends upon two other properties of machine, that are –
- Velocity Ratio – It is that property of a machine which depends upon the construction or design features of machine. It is the ratio of distance moved by effort to the distance moved by the load. It can be obtained by measuring the relevant dimensions of components of any machine even when the machine is not working.
- Mechanical Advantage – It is that property of a machine which doesn’t depends upon the construction or design features of any machine. It is the ratio of load lifted at output point (i.e., load) and force applied at input point (i.e., effort) of the machine. It can be obtained only when the machine is put on working.
Machine efficiency is defined as the ratio of above mentioned two quantities.
Thus, machine efficiency is defined as the ratio of the mechanical advantage we get by the working of machine and the velocity ratio of the machine. Therefore, efficiency \quad \eta = \left ( \frac{\text {MA}}{\text {VR}} \right )
Machine efficiency is also defined in a different way –
Efficiency of a machine is defined as the ratio of output work to the input work.
Therefore, efficiency \quad \eta = \left ( \frac{\text {Output work}}{\text {Input work}} \right )
Illustration of Machine Efficiency
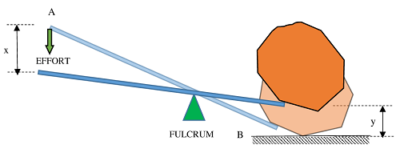
Consider about working of a lever as shown in figure.
Suppose that, an effort ( P ) is applied for time ( T ) . In this time, let the effort point ( A ) moves through a distance ( x ) and load point ( B ) moves through a distance ( y ) .
As per definition of work –
\text {Work done} = \text {Force} \times \text {Distance}
Therefore, input work to machine is ( P \times x ) and output work from the machine is ( W \times y )
In the absence of frictional force, by law of conservation of energy –
( P \times x ) = ( W \times y )
Or, \quad \left ( \frac {W}{P} \right ) = \left ( \frac {x}{y} \right )
But, \left ( \frac {W}{P} \right ) is called Mechanical Advantage of a machine and \left ( \frac {x}{y} \right ) is called Velocity Ratio of a machine.
Therefore, for an ideal machine –
\text {Mechanical Advantage} = \text {Velocity Ratio}
But, in actual conditions all machines have friction. Therefore, a certain amount of input work is lost in friction which is converted into heat energy which causes wear and tear of machine components.
Therefore, in actual machines output work is always less than the input work. This reduces the performance of a machine. Hence, the term efficiency is used to represent the performance of a machine.
Existence of friction in moving parts of machines has brought the concept of efficiency of a machine.
Therefore, efficiency of a machine explains that – “How much a machine is capable to overcome friction with minimum loss of input energy”?
Magnitude of Efficiency
Efficiency of a machine is given by –
\eta = \left ( \frac{\text {Output work}}{\text {Input work}} \right ) = \left ( \frac {Wy}{Px} \right )
= \left ( \frac {W}{P} \right ) \times \left ( \frac {y}{x} \right )
= \left ( \frac {W}{P} \right ) \div \left ( \frac {x}{y} \right )
= \left ( \frac {\text {Mechanical Advantage}}{\text {Velocity Ratio}} \right )
Therefore, efficiency of a machine is also defined as the ratio of mechanical advantage (MA) and velocity ratio (VR).
But, for an Ideal machine, \quad \text {MA} = \text {VR}
Therefore, efficiency of an ideal machine will be \quad \eta_{Ideal} = 1
Velocity ratio of a machine is a design based dimensional parameter and it depends only on geometry of the machine components. This is the reason that, velocity ratio is independent from effect of friction.
Ideal Effort & Actual Effort
By re-writing expression for efficiency, we get –
\eta = \left ( \frac {Wy}{Px} \right )
Or, \quad P = \left ( \frac { Wy }{ x \eta } \right )
But, efficiency of an ideal machine is –
\eta_{Ideal} = 1
Therefore, \quad P_{Ideal} = \left ( \frac { W y }{ x } \right )
Let, ( P_{Actual} ) is the actual effort required to do same quantity of work ( W ) . Then –
P_{Actual} = \left ( \frac { Wy }{ x \eta} \right )
Hence, ratio of Ideal effort and Actual effort will be-
\left ( \frac {P_{Actual}}{P_{Ideal}} \right ) = \left ( \frac { Wy }{ x \eta} \right ) \div \left ( \frac { Wy }{ x } \right )
= \left ( \frac {1}{\eta} \right )
Therefore, efficiency of machine can also be expressed as –
\eta = \left ( \frac{\text {Ideal effort}}{\text {Actual effort}} \right )
= \left ( \frac { P_{Ideal}}{ P_{Actual}} \right )
Law of Machine
By experiments, a linear relation is obtained between actual effort ( P_{Actual} ) , the applied load ( W ) and friction effect ( C ) . This relation is expressed as –
P_{Actual} = m W + C .
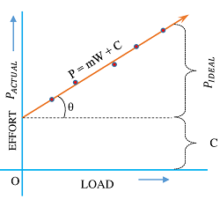
This expression is called Law of a Machine.
A graph can be plotted for the results obtained from experiments. To draw the graph different values of effort is applied on machine and the corresponding values of the loads are noted. The values of load ( W ) are plotted on the X axis and the effort ( P ) on the Y axis.
This graph is known as Load – Actual effort graph.
For an ideal machine the graph is a straight line which passes through origin. But for an actual machine, straight line passes with intersection on the Y axis with an intercept ( C ) in positive side.
In equation, value of ( C ) indicates the effort required to overcome the friction when there is no load on the machine. It is the quantity of effort required to run or start the machine without any load.
Slope of the straight line graph is –
m = \tan \theta
Also, from geometry of graph –
\tan \theta = \left ( \frac {P_{Ideal}}{W} \right )
Therefore, \quad P_{Ideal} = m W
But, Mechanical advantage is –
MA = \left ( \frac {W}{P_{Ideal}} \right ) = \left ( \frac {W}{mW} \right )
= \left ( \frac {1}{m} \right )
Therefore, \quad \tan \theta = \left ( \frac {1}{MA} \right )
Hence, equation for the straight line can also be written as –
P_{Actual} = P_{Ideal} + C
= m W + C
Graph of Load & Ideal Effort
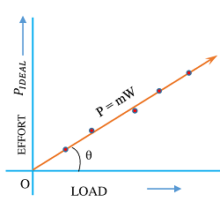
We can plot a graph between load ( W ) and ideal effort ( P_{Ideal} ) to get a relation between them.
To draw the graph, different values of loads are applied on machine and corresponding values of effort are noted. Values of load ( W ) are plotted on X axis and effort ( P_{Ideal} ) on Y axis.
In ideal conditions, a machine is considered to have no friction. Thus the value of ( C ) becomes zero.
Hence, graph of load – ideal effort is a straight line which passes through the origin as shown in figure.
Equation for this line will be –
P_{Actual} = m W
Here, constant term ( C ) becomes zero because there is no friction.
Graph of Load & Mechanical Advantage
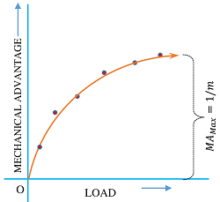
To get a relation between load & mechanical advantage MA , different values of loads are applied on machine and the corresponding values of the MA are noted. Values of loads are plotted on X axis and corresponding values of MA on Y axis.
The graph of load and mechanical advantage is a curve as shown in figure.
From the graph, it is clear that, as load increases, mechanical advantage also increases. But, due to the presence of friction, the rate of increase of mechanical advantage is lower than the rate of increase of load. Hence, the curve bends towards base at high loads.
Since, ( C ) is a constant term in expression for law of machine, hence the effect of ( C ) is high when ratio \left ( \frac {W}{P} \right ) is low.
At higher values of ratio \left ( \frac {W}{P} \right ) , effect of ( C ) gradually decreases and eventually its effect becomes negligible. So the curve becomes flat nearly parallel to X axis.
Graph of Load & Efficiency
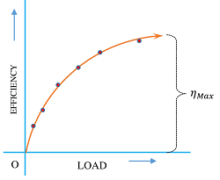
To draw a graph between load and percentage efficiency, different values of loads are applied on machine and corresponding values of efficiencies are noted. Values of loads are plotted on the X axis and percentage efficiency on Y axis.
The graph of load and percentage efficiency is a curve as shown in figure.
Since, velocity ratio is based on design and dimensional parameter and depends upon geometry of machine components, hence it remains constant at all loads. But mechanical advantage depends on load and increases with increase in load.
Because of increase of mechanical advantage, percentage efficiency also increases with increase in load. But the rate of increase of efficiency is lower than the rate of increase of applied load. Hence the curve bends and eventually becomes nearly parallel to the X axis at much higher loads.